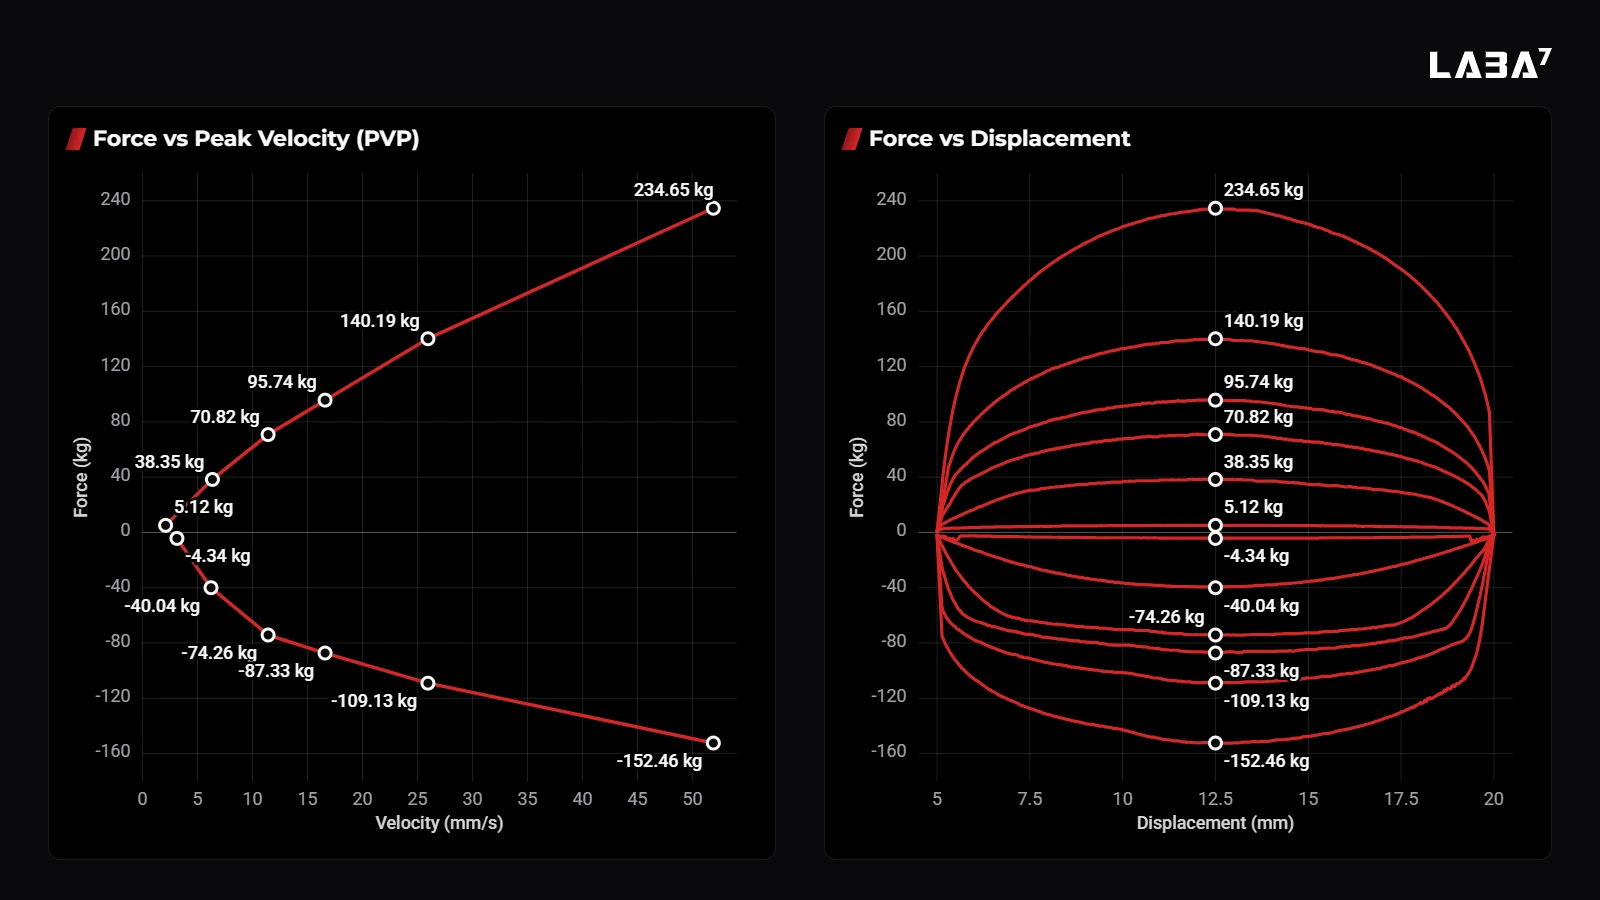
A lot of professionals still judge a shock absorber by its peak velocity plot (PVP). But relying solely on PVP alone does not show the full picture of what damper is doing.
In this article we will share a few discoveries we made in the past two years.
Why we look at the potato?
First of all, we want stress that PVP is a great graph. It is easy to read, it allows to compare different runs easily, and is very useful when checking whether a damper meets the target forces at selected velocities.
But during the stroke, before reaching maximum velocity, there can be force irregularities, hysteresis, or inconsistencies between cycles. These are easy to overlook when the result you are looking at is reduced to a few points.
Here’s where force-displacement graphs, or “potato” graphs, come into play. They show how force changes throughout the stroke. You can see the compression and rebound loop, compare successive cycles, and look for irregularities that deserve attention.
They take a little practice to read. But once you know what to look for, they become a very useful.
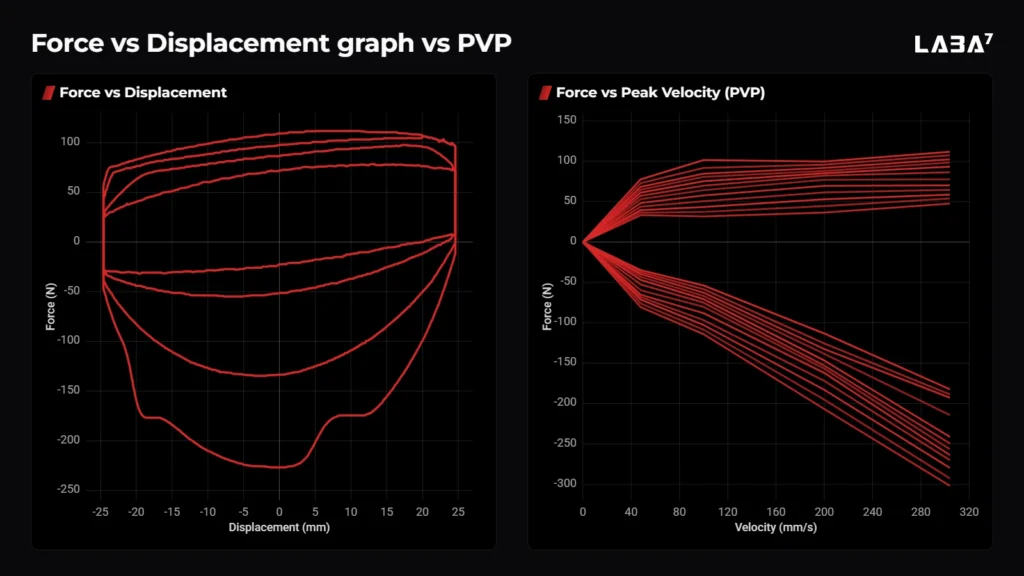
One of our customers explained their approach quite simply. They use force-displacement graphs to check if a shock works smoothly and without errors. For tuning, they use force-velocity graphs because comparing changes across multiple iterations is quick and straightforward.
That makes sense. One should use different graphs because one needs to answer different questions. Meeting the target force at selected velocities is one of those questions.
Real story of what PVP can miss
Here’s a curious case that happened last year.
During an R&D session on our EMA, a one of our customers noticed small inconsistencies in low-speed damping. Force offsets kept appearing between runs. Very unusual behaviour as our damper testing machines deliver very repeatable results.
Regardless, we decided to check the software before ruling a mischevious bug out.
Before we compeleted our tests, the customer themselves found the cause and inside the damper. A metal particle was stuck in the shim stack. Smaller than a millimetre. Most likely, it had entered during oil filling (they did not use our shock vacuum bleed pumps!).
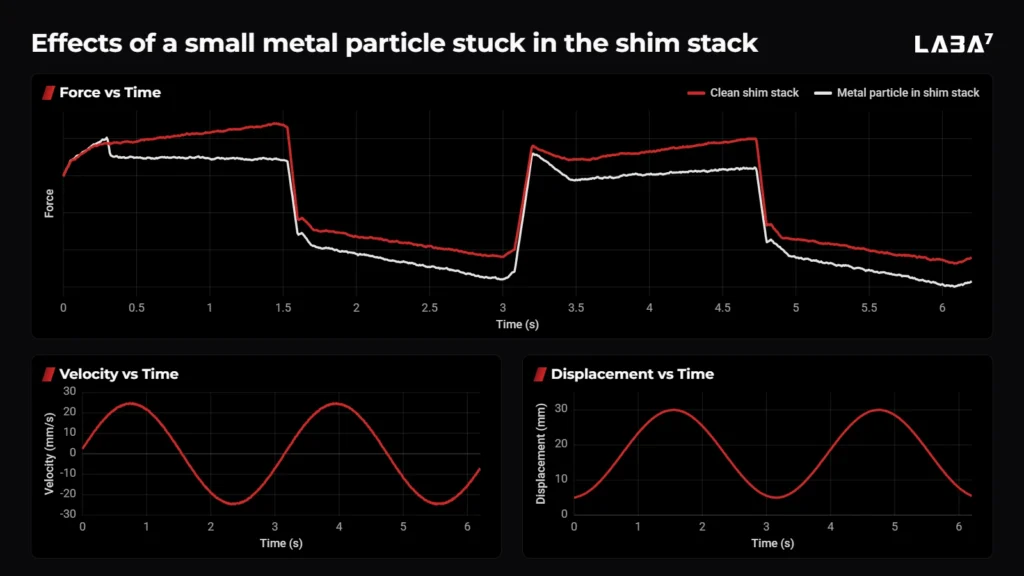
That one small metal flake was enough to affect the measured force and show up in the graphs. If the customer had only checked selected PVP values, the issue could have been overlooked.
Cases like this are why we spend time looking at the full cycle. They are also perfect illustrations of how precisely our EMA system captures even the slightest deviations in force, enabling R&D teams to pinpoint exactly what’s happening inside their damping systems.
What to look at beyond the peak points?
- Start with the shape of the “potato”. Two dampers can produce very similar PVP results, but overlay their force-displacement graphs and you may find differences between them.
- Look at what happens around direction changes and near zero velocity. Friction and seal drag matter here.
- Gas force also needs to be considered when comparing curves, including whether it has been compensated for in the software. Unexpected flattening or delayed force build-up may need investigation for cavitation or another problem.
- Then there is temperature. Does the damper behave the same way after several cycles? Comparing readings of cold and hot shock absorber helps you see changes that a single summary can miss.
- The transition between low-speed and high-speed damping is another area worth examining.
- You do not need every graph for every job but before deciding that a damper is working correctly, it is worth comparing damper behaviour in a few of them.
What we are working on
Over the years, we have spent a lot of time testing dampers and helping customers understand what they see in their data. That experience feeds directly into our software development.
For the past year, we have been working on updates to how damper graphs are displayed and read.
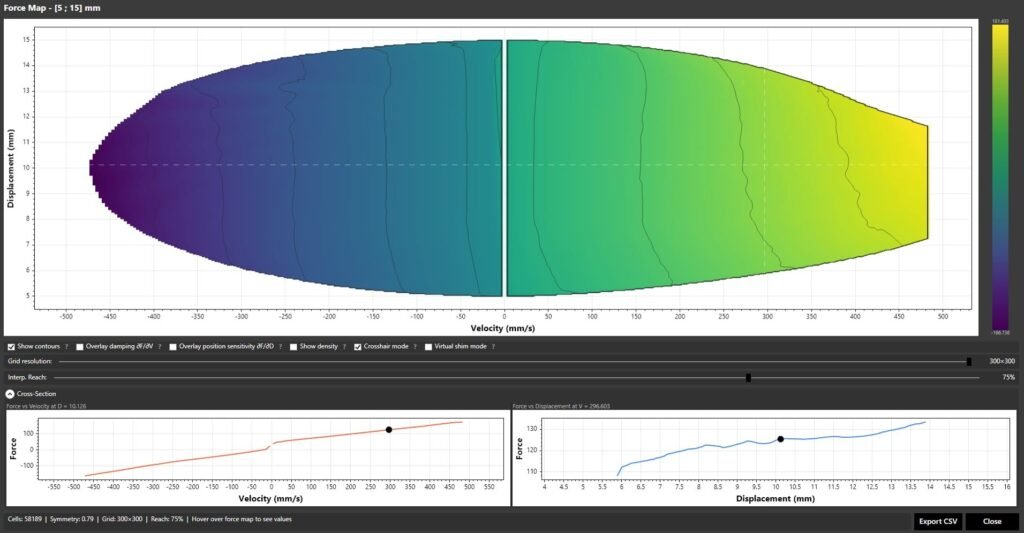
We will show you more soon. For now, here’s a teaser.