
Every damper test rig brochure quotes force and velocity. Little of them mentions the things that help you decide whether you can trust the data that comes out.
Here are some of the points that we learned our customers should ask. Including the questions that make our own numbers look less impressive than they could.
Capacity is Not Accuracy
“Bigger load cell = better machine” is one of the most misleading claims in testing equipment marketing.
Almost every standard load cell – pancake, S-type, lever type – specifies creep and accuracy at roughly +/-0.01-0.02% of Full Scale Output. That number does not improve because the capacity is bigger. Here’s what we mean:
- 0.01% of 50 kN = 5 N of error.
- 0.01% of 10 kN = 1 N of error.
Same specification, but actual accuracy is five times worse in practice.
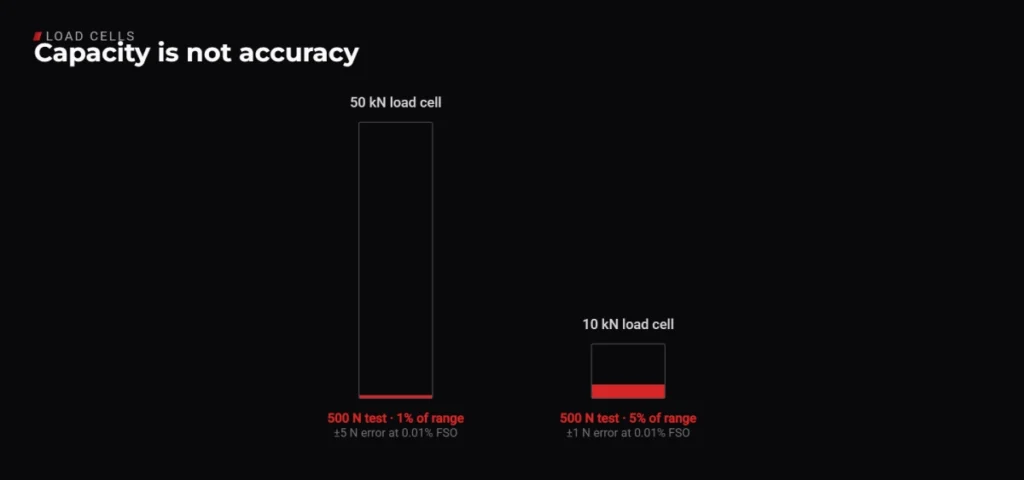
So, if you are testing at 500 N on a 50 kN load cell, you are operating at 1% of its range. You are not getting better accuracy, you are getting a number that is harder to trust. The electronics and amplifier don’t magically scale either. A 10 kN test deserves a 10 kN load cell, not a 50 kN one.
During the meetings with suppliers, ask which load cell options are available, not only what the maximum is.
Requested Waveform, or Executed Waveform?
A few weeks ago we were in a discussion about how some machines show perfect velocity and displacement graphs even during non-linear tests – tests that should not produce beautiful graphs.
After digging a bit, the explanation was simple (and a bit sneaky): they publish the requested waveform, not the executed (performed) waveform.
Displacement versus time usually looks clean, because it is the measured position signal and small ripple is hard to notice at that scale – and is often filtered. Velocity versus time is typically calculated from position, so even tiny position fluctuations become very visible in the velocity trace.
This matters more than it sounds, because if executed velocity is not tracking the request, your force versus time plot contains machine and control behaviour, not only damper response. So, in the end, you are looking at a picture of a test bench struggling, and calling it damper data.
To avoid being swayed by beautiful graphs, ask which one you are being shown. Even better – ask to see both and overlay them.
The Waveform Trick
Here’s another case we came accross: same force, same maximum speed, but different acceleration. How can this be?
We ran two profiles with identical maximum velocity (1,000 mm/s), identical peak force (around 3.5 kN) and identical stroke (100 mm). One thing changed: the velocity waveform.
- With a sinusoidal velocity profile, peak acceleration hit about 2.7 g.
- With a triangular velocity profile, about 1.35 g.
So you can roughly halve the acceleration a rig actually has to deliver while the headline numbers – force and speed – look identical on paper.
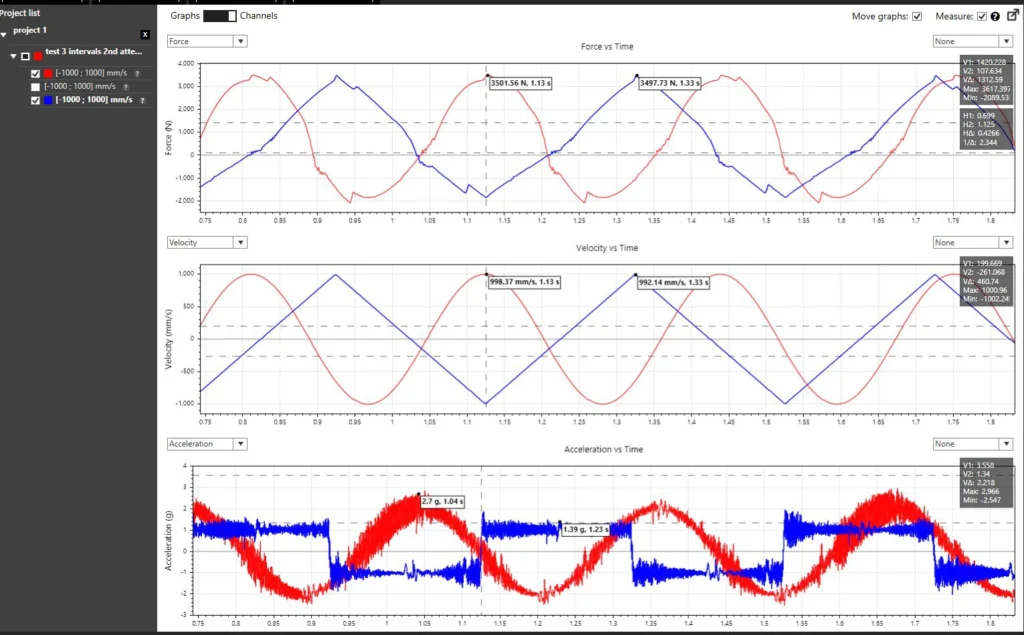
There is nothing wrong with alternative profiles. But it has to be stated. If the target test is a clean sine, which is common in RFQs, then waveform accuracy is everything. Once a rig starts distorting the motion, you can no longer tell whether a strange result came from the damper or from the bench.
When you compare two machines with similar specifications, ask three things:
- Which waveform type is that quoted at? Sine, triangle, something else?
- What is the maximum achievable acceleration?
- What tracking error is considered acceptable?
Four Linear Actuator Types, Good and Bad
In customer meetings we keep hearing strange “facts” about linear actuators. There are four main types on modern test benches, and they are not interchangeable.
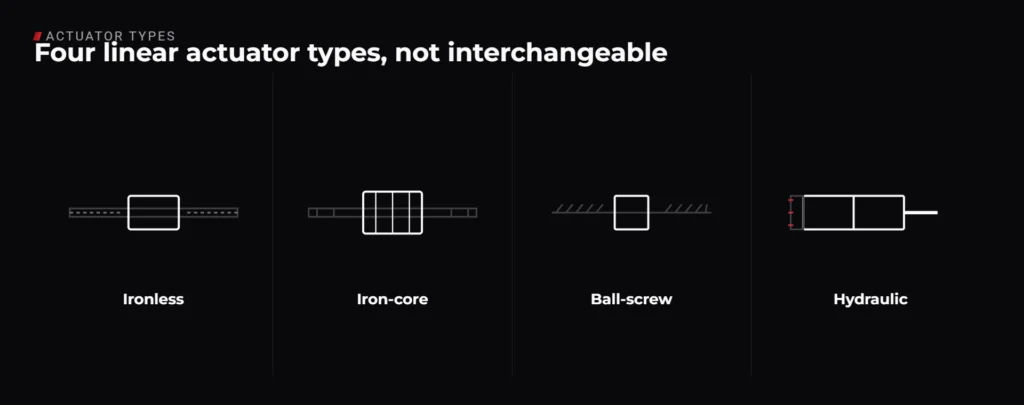
Ironless linear motors
Good: Ultra-smooth motion, zero cogging, excellent for precise control, very high speeds and accelerations, almost no maintenance if designed right.
Downsides: Lower force density, and cooling is more challenging at high power.
Iron-core linear motors
Good: Higher force density, easier to water-cool, a good choice for high-force applications.
Downsides: They cog, they are heavier, and that limits acceleration and top speed compared with ironless designs.
Ball-screw actuators
Good: Usually the most cost-effective option and capable of high loads.
Downsides: Limited speed and acceleration versus direct drive. They also require regular maintenance – screws, nuts, lubrication, backlash.
Hydraulic actuators
Good: Still the king of power density.
Downsides: Precise control is possible, with limits and complexity. Requires expensive high-pressure infrastructure and regular maintenance to stay leak-free and consistent.
Which is better?
So, as you see there is no perfect linear actuator. All of them have their design trade-offs.
What “Standard” Should Mean?
We had a few customers asking if we can do sine-on-sine graphs because some companies highlighted this waveform generation as a headline feature. A selling point.
On a rig with a programmable actuator, custom waveform stacking and arbitrary profiles are motion control – the actuator is already capable, the control software already runs the loop.
A crank-driven machine converts rotation into one sinusoid. No firmware unlocks a second one. That is geometry, not packaging, and it is the honest dividing line between the two classes of machine.
If your main tasks are damper service, tuning, QC, comparative before-and-after work, then a Scotch-yoke shock dyno covers it, at a fraction of the cost.
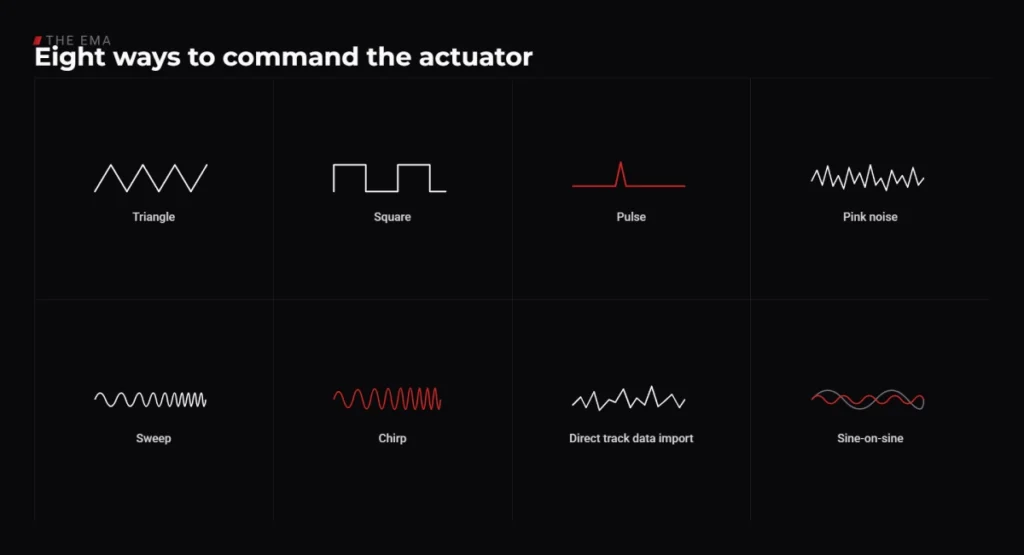
If you need anything beyond that – a programmable actuator is the go-to. On our EMA that means:
- Triangle. Constant velocity through each stroke, reversing at the ends. Holds the damper at one known velocity instead of sweeping through every velocity on the way to peak, so you read force at that velocity directly rather than interpolating it off a sine trace.
- Square. A commanded step in velocity. Tests how fast the valve responds – build-up time, lag, gas force at the step – rather than steady-state damping. What you actually measure is the damper and the rig’s tracking together, which is why executed-versus-requested matters most here.
- Pulse. A single short event, then return. A kerb strike, an expansion joint, a landing. Used for transient response and for provoking cavitation and aeration you will never see in a steady sine.
- Pink noise. Broadband random excitation with energy falling as frequency rises – close to the shape of real road roughness. Excites the whole working range in one run instead of testing one frequency at a time.
- Sweep. Frequency walked across a range at controlled amplitude. Finds frequency-dependent damping and resonances, and shows where a damper’s behaviour changes rather than just what it does at one test point.
- Chirp. The same idea run as a continuous fast ramp. Delivers a frequency response in seconds instead of a stepped sequence – the tool for quick system identification between setup changes.
- Direct track data import. Logged damper motion from an actual circuit, replayed on the bench. The damper sees the real duty cycle – velocity distribution, reversal density, thermal load.
- Sine-on-sine. Separates wheel-rate input from body motion and exposes friction and hysteresis around a non-zero velocity, which a single sine through zero cannot show.
Not sure which side of that line your work sits on – tell us what you need to measure and we will say which waveform covers it.
Our Own Numbers
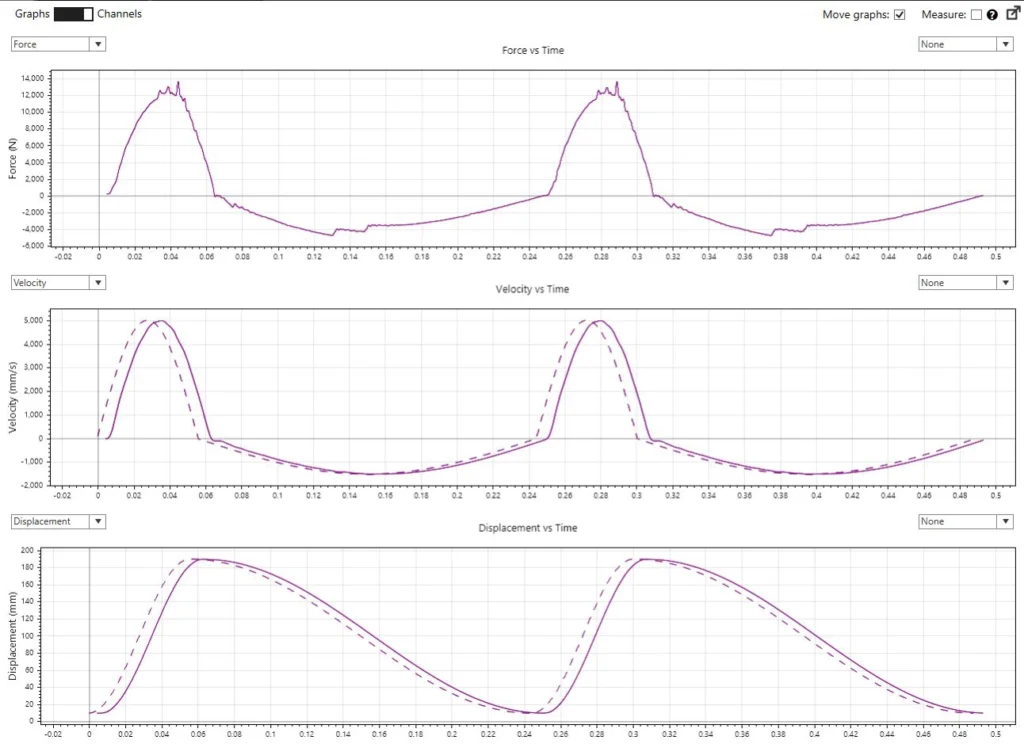
So that you can hold us to the same standard, here is a single cycle from a LABA7 EMA running at 5,000 mm/s compression and -1,500 mm/s rebound on a very uneven damper:
- +5,000 mm/s target, 5,000.6 mm/s measured
- -1,500 mm/s target, -1,501.9 mm/s measured
- Position: -0.53 mm at the 190 mm peak, +0.07 mm at the 10 mm base – about 0.33% of a 180 mm stroke
- Peak load 12-13 kN while holding those errors
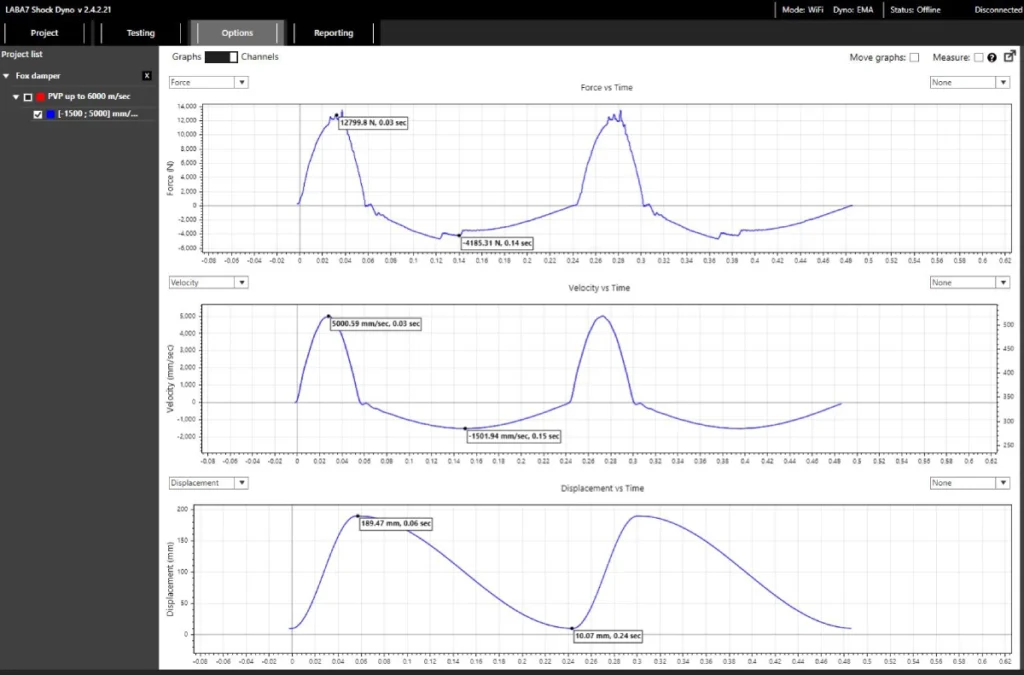
We publish these because this is what the conversation should look like. And we would genuinely like an answer to the question nobody in this industry seems willing to put in writing. What do you consider acceptable:
- Velocity accuracy at plus or minus 5 m/s – one percent, half a percent, better?
- Stroke accuracy over 180-200 mm?
- Force repeatability under 10-15 kN? Zero-crossing behaviour and velocity ripple?
- Cycle-to-cycle repeatability you would sign off on?
Have some questions of your own? Contact our CEO, Andrius Liškus.