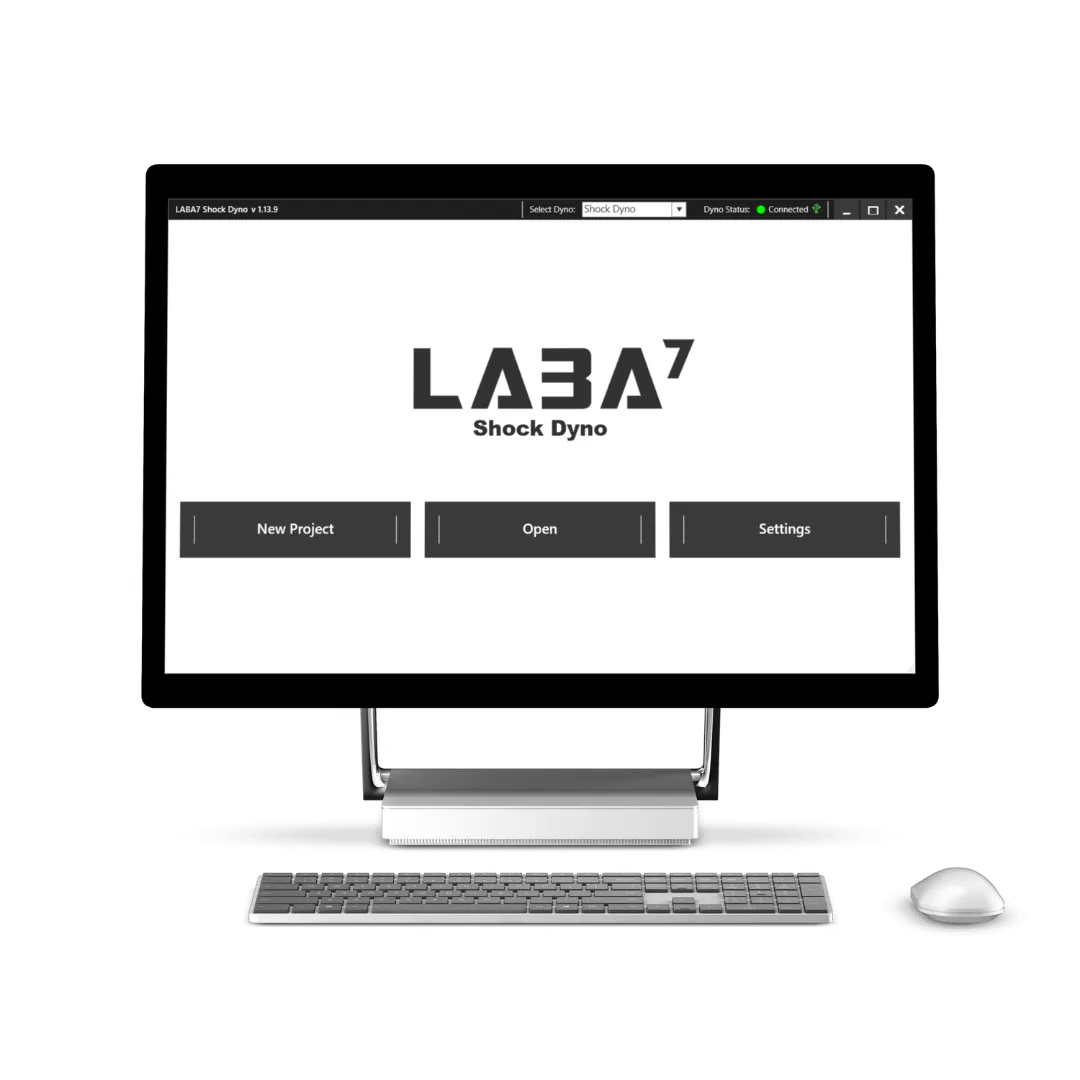
Meet the shock dyno software
LABA7 shock dyno software is so easy to use, anyone can do it. Easy-to-understand graphs and live data are at your fingertips.
User-friendly dyno software
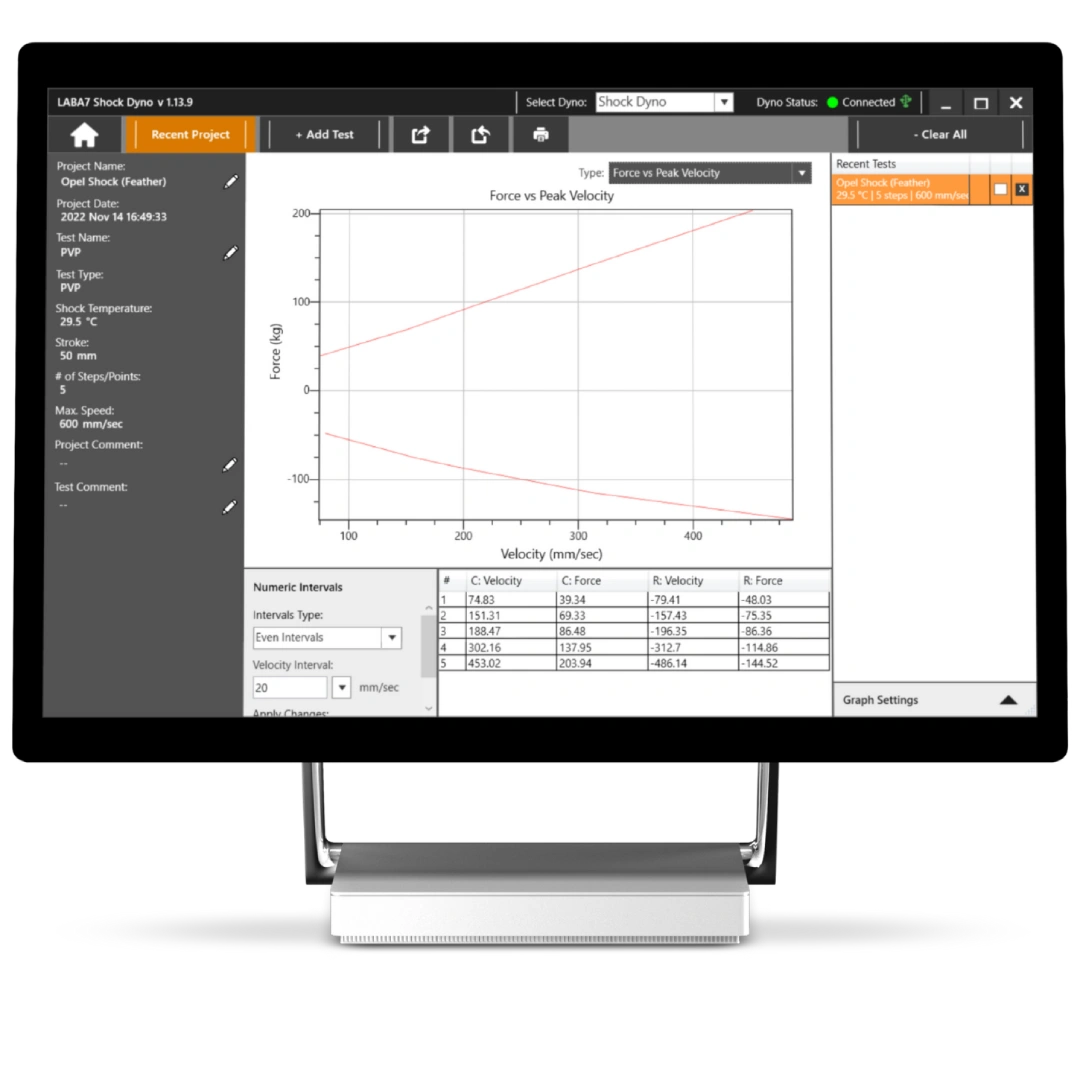
With a press of a button, you can see live shock dyno graphs of the damper you are testing. Whether it is Force vs. Displacement or Force vs. Velocity – you get all the data plotted to test the performance of your shock.
Outstanding quality control
We have full control over the development process. It allows us to optimize the products for accuracy and being easy to work with.
Superior dyno graphs
Our shock absorber dyno software is written, tested, and maintained in-house. This allows us to keep the software up-to-date without compromising your experience, including new features, regular updates, and efficient issue-solving.
Modern and easy-to-use
LABA7 data logger is capable of reading up to 64 000 samples per second. This colossal amount of information is processed by our software and visualized in graphs. Processing the data minimizes electric noise as well, enabling you to use precise graphs with exceptional precision.
Knowledge and expertise
Unlike some outdated and complex applications in the market, our software utilizes the benefits of C# programming language and the latest .Net framework. These and other contemporary technologies ensure an intuitive and easy-to-understand user experience.
LABA7 shock dyno software features
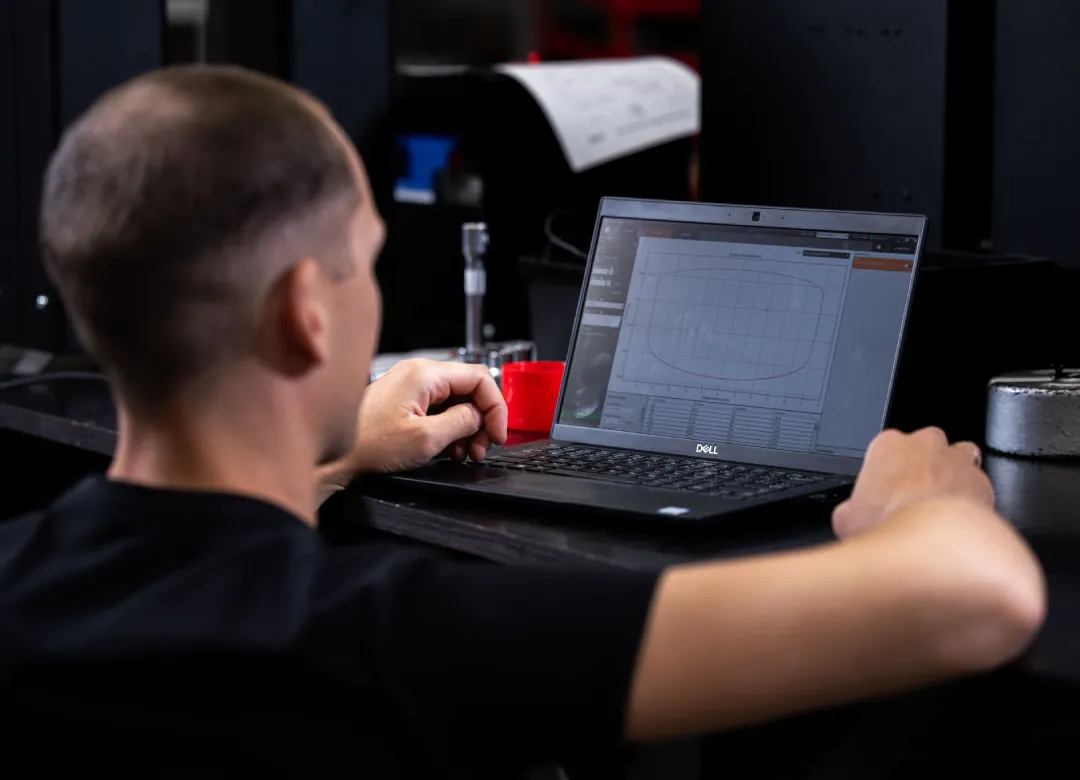
Graphs generated by LABA7 software
Every second our capable data logger collects so much information humans can’t read it all. That is why our software visualizes this staggering amount of information into easy-to-read shock dyno graphs.
If you would like to know more about the graphs and the information they provide, check this article on how to read shock dyno graphs.
Force vs. Displacement

PVP – Peak Velocity Plot
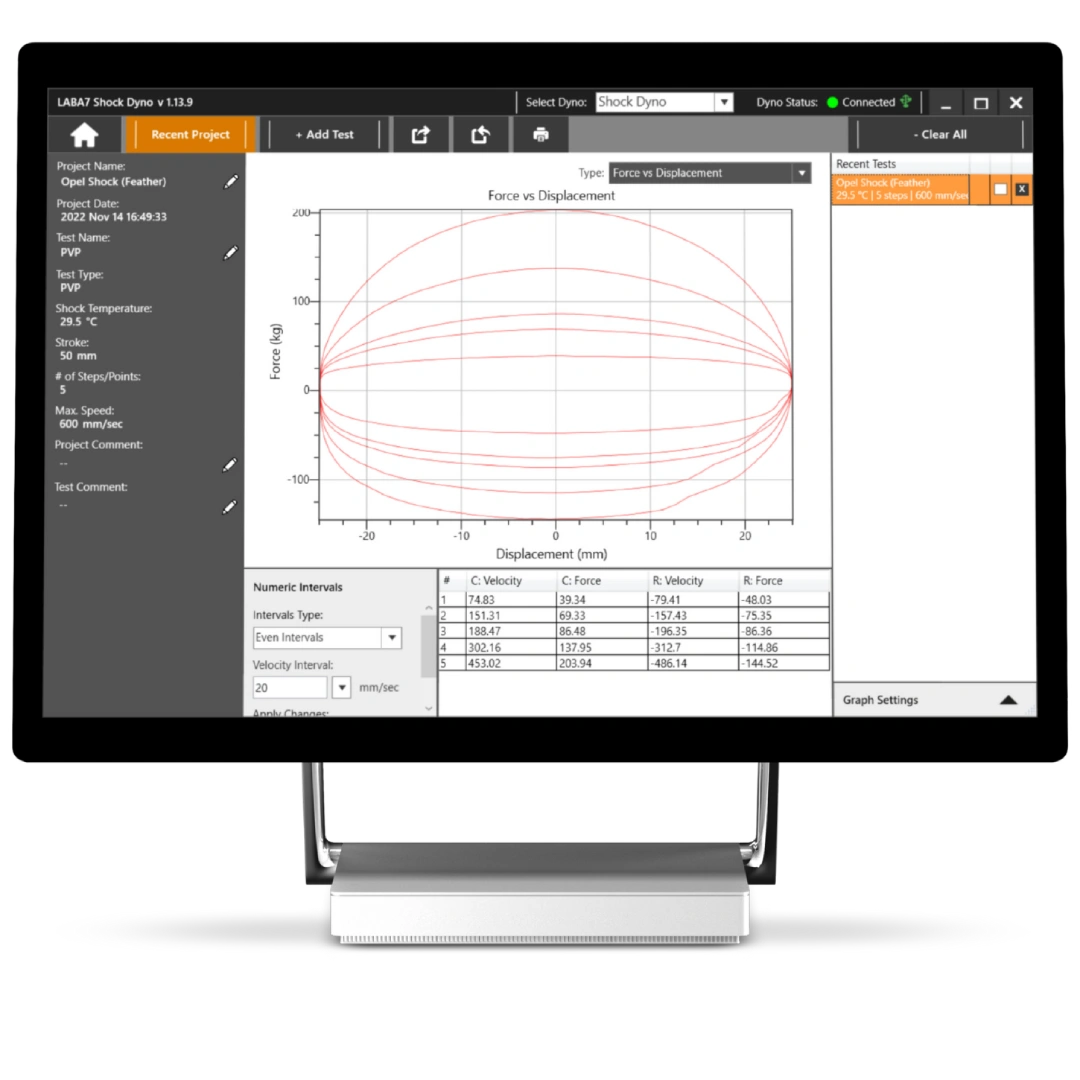
Avg. Force vs. Displacement
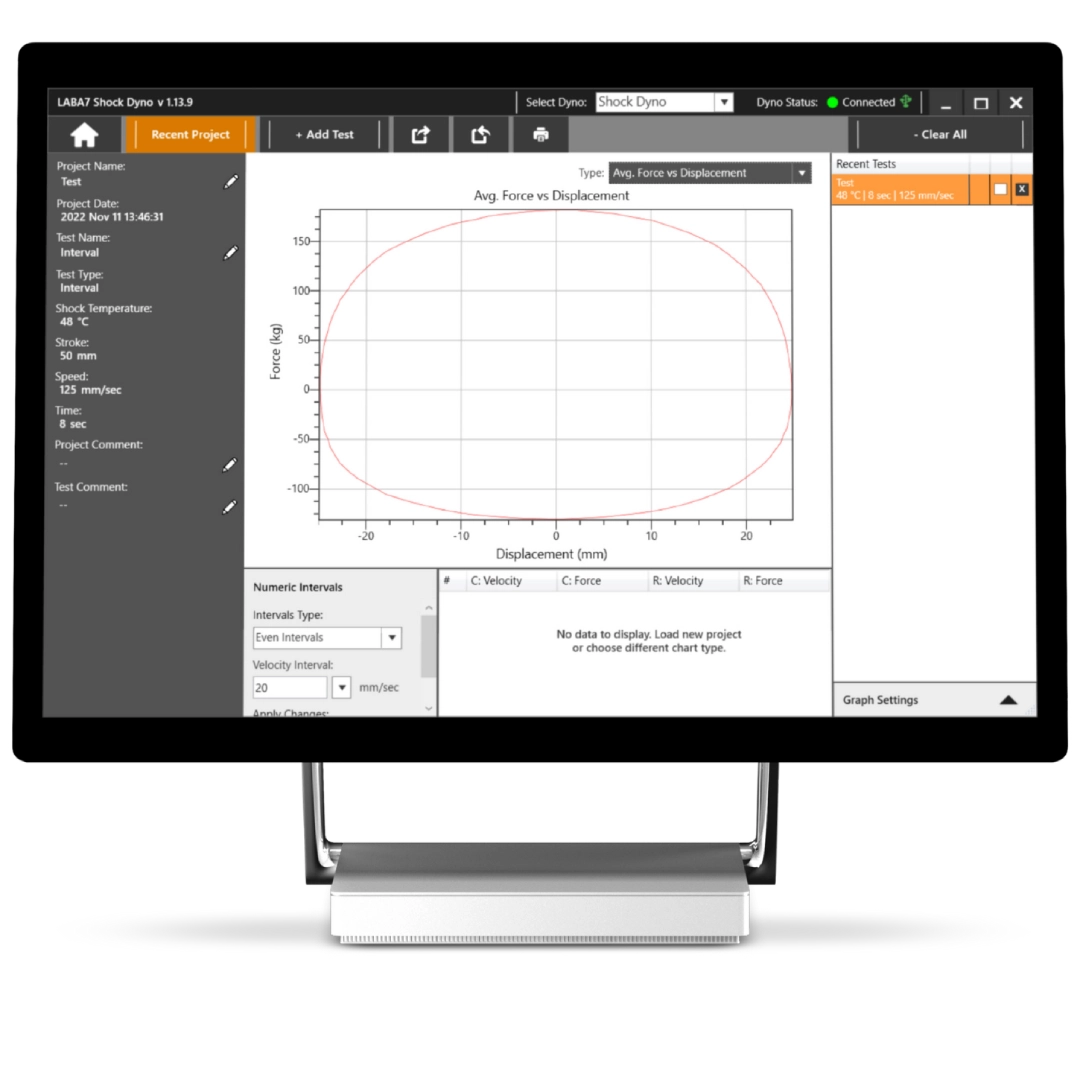
Force vs. Velocity
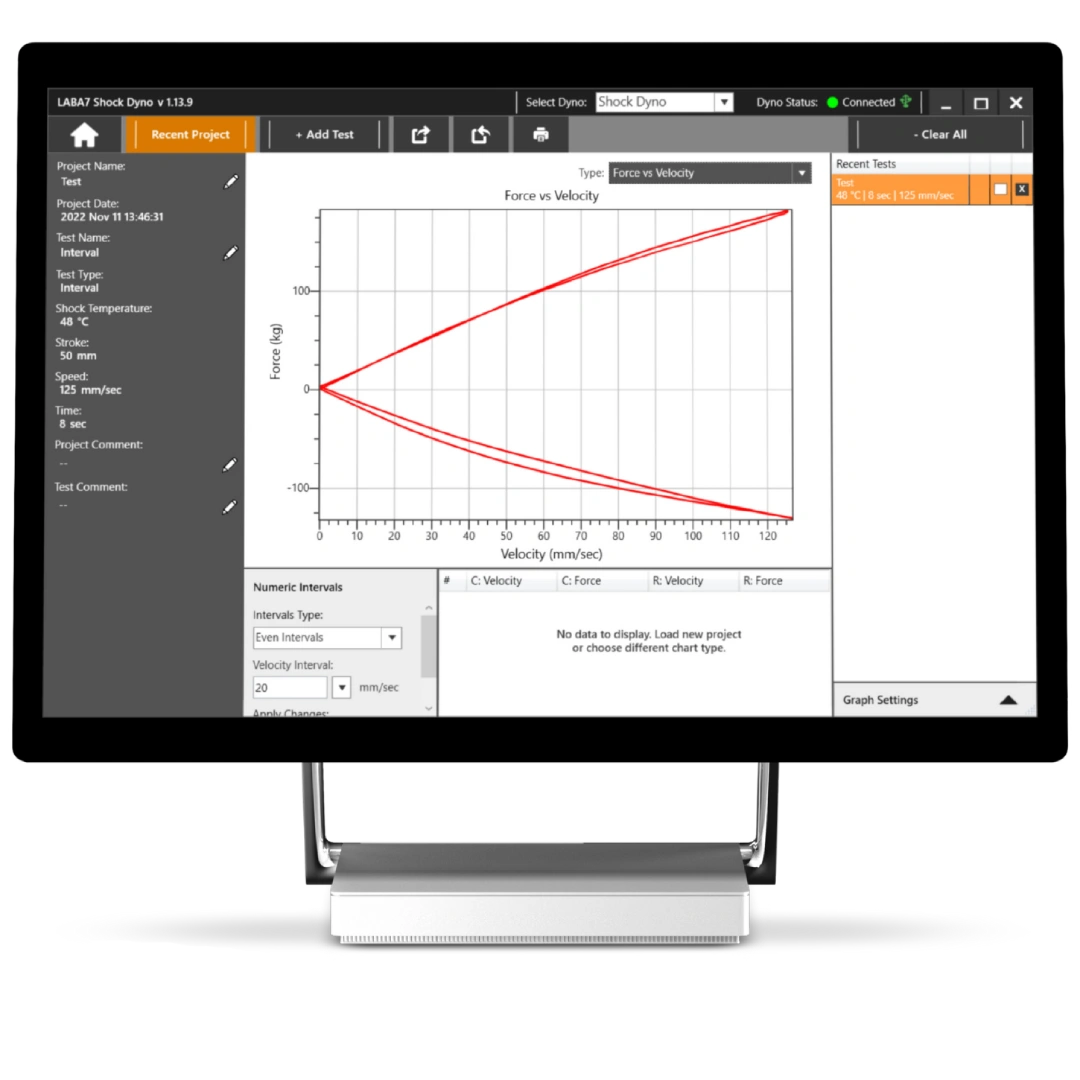
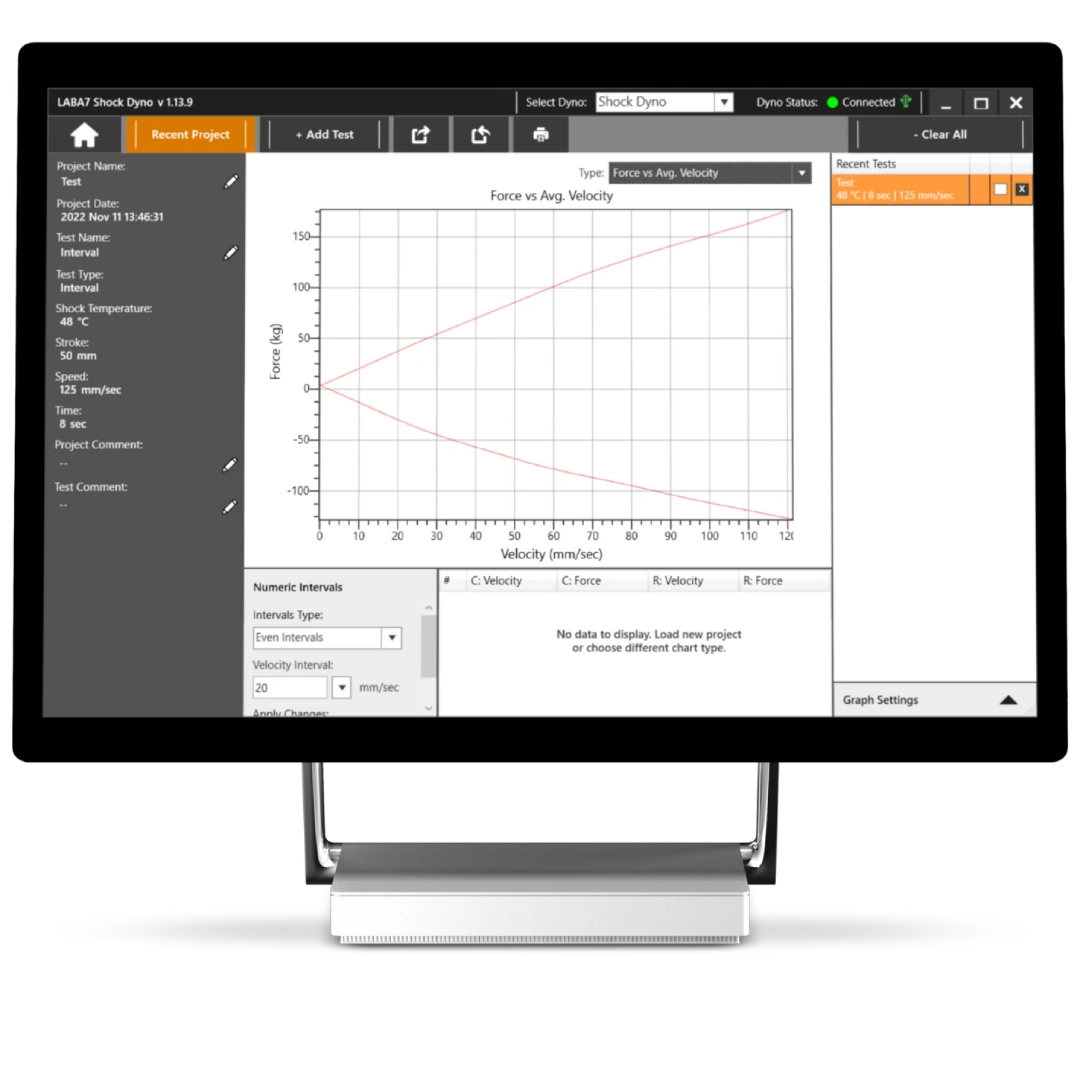
Force vs. Average Velocity
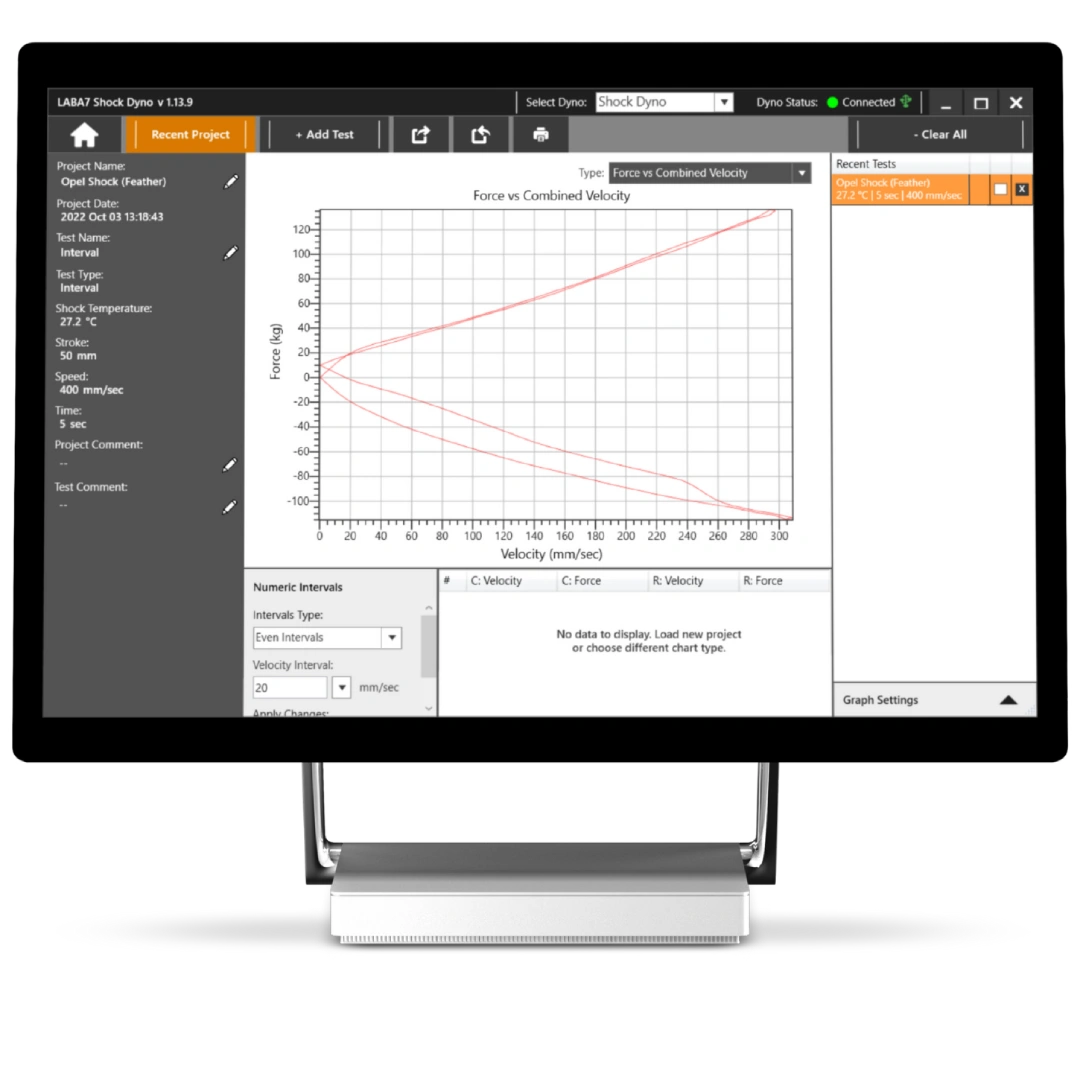
Force vs Combined Velocity
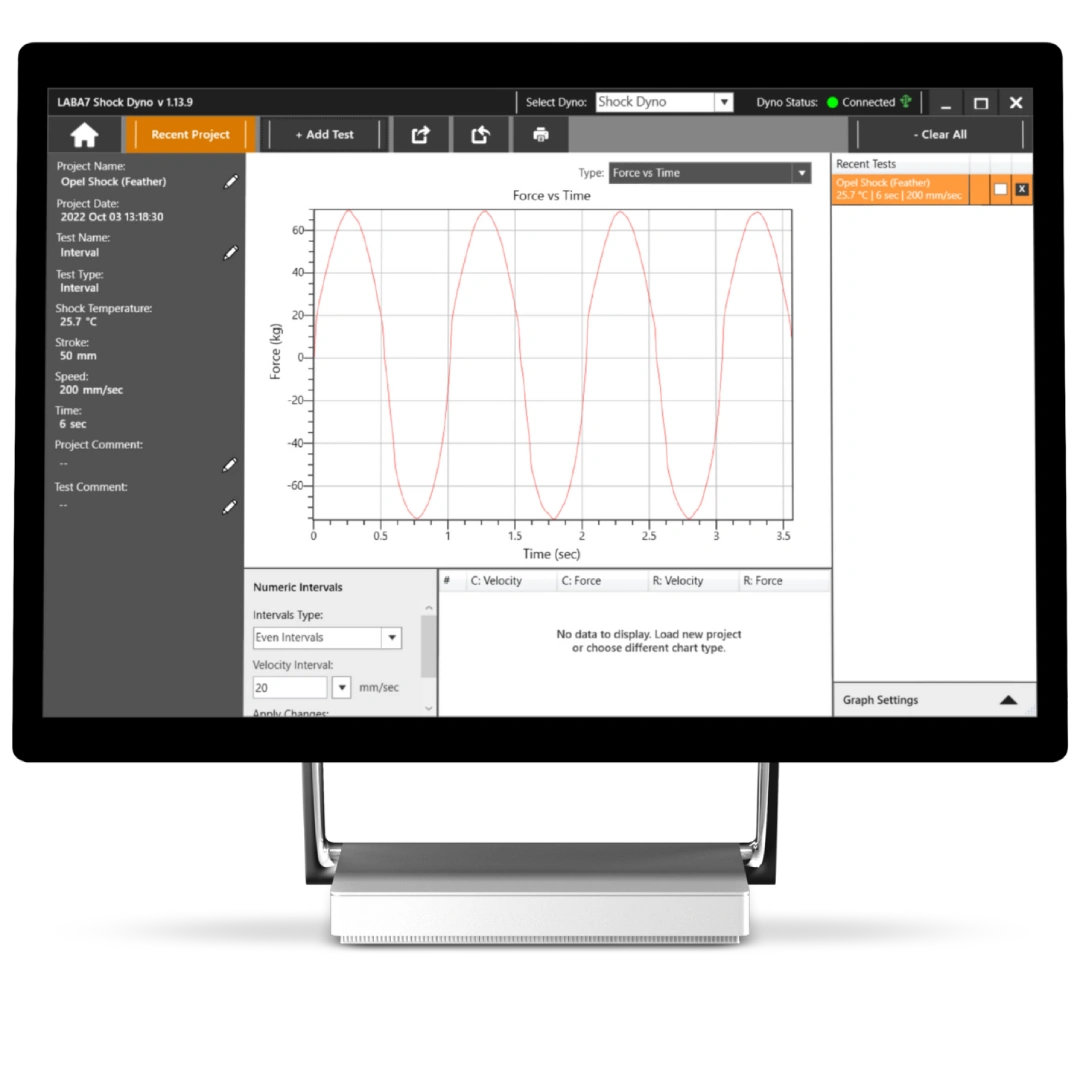
Force vs. Time
Force vs. Peak Velocity
Temperature vs Time

Smart and custom features
By developing the shock absorber dyno software in-house, we can create tailored features that our customers need. Later we deploy these valuable functionalities for all our clients and partners.

